- 金币:
-
- 奖励:
-
- 热心:
-
- 注册时间:
- 2006-7-3
|
|

楼主 |
发表于 2009-3-26 09:08
|
显示全部楼层
Saturday, November 29, 200811/28/2008 Market Recap: Market Overbought
Over the short term, the market is overbought, and may pullback at some point in the next week. Over the intermediate term, an encouraging signal appeared on Friday. Of course, the signal needs to be confirmed by the location where the pullback finishes, and it has to be a higher low.
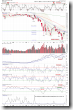
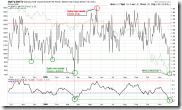
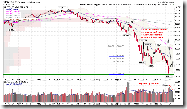
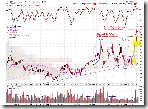
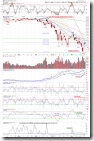
[url=http://stockcharts.com/def/servlet/Favorites.CServlet?obj=ID2393449&cmd=show[s139439402]&disp=P]0.0.2 SPY Short-term Trading Signals[/url]. NYADV and NYMO, which are used to be quite accurate, are overbought now. Yes, Market may ignore these overbought signals temporarily, however do anyone really believe that NYADV will stay at overbought level and never come down?
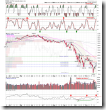
[url=http://stockcharts.com/def/servlet/Favorites.CServlet?obj=ID2393449&cmd=show[s126616985]&disp=P]1.0.3 S&P 500 SPDRs (SPY 60 min)[/url], RSI is overbought. As mentioned in the past, RSI overbought/oversold on the 60-min chart is quite accurate.
[url=http://stockcharts.com/def/servlet/Favorites.CServlet?obj=ID2393449&cmd=show[s134696784]&disp=P]1.0.4 S&P 500 SPDRs (SPY 15 min)[/url], [url=http://stockcharts.com/def/servlet/Favorites.CServlet?obj=ID2393449&cmd=show[s134697338]&disp=P]1.1.6 PowerShares QQQ Trust (QQQQ 15 min)[/url], Bearish Rising Wedge, MACD and RSI show negative divergence.
As a summary, I believe a pullback is due in the short term.
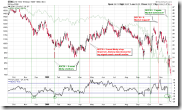
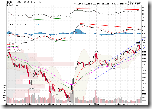
[url=http://stockcharts.com/def/servlet/Favorites.CServlet?obj=ID2393449&cmd=show[s154170446]&disp=P]0.0.3 SPX Intermediate-term Trading Signals[/url]. NYSI buy signal. So far, all mid-term signals are buy.
[url=http://stockcharts.com/def/servlet/Favorites.CServlet?obj=ID2393449&cmd=show[s139935158]&disp=P]2.3.4 Nasdaq Total Volume/NYSE Total Volume[/url]. Spike low, it looks very encouraging and like a bottom. Last time of spike low is March, and then the market rallied for two months.
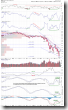
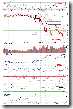
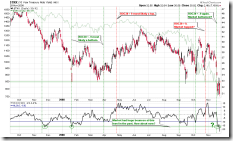
[url=http://stockcharts.com/def/servlet/Favorites.CServlet?obj=ID2393449&cmd=show[s122111676]&disp=P]3.0.0 10Y T-Bill Yield[/url]. Yield is dropping down continuously, which looks encouraging too.
Because of [url=http://stockcharts.com/def/servlet/Favorites.CServlet?obj=ID2393449&cmd=show[s139935158]&disp=P]2.3.4[/url] and [url=http://stockcharts.com/def/servlet/Favorites.CServlet?obj=ID2393449&cmd=show[s122111676]&disp=P]3.0.0[/url] signals, the mid-term outlook should be promising.
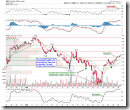
[url=http://stockcharts.com/def/servlet/Favorites.CServlet?obj=ID2393449&cmd=show[s130140412]&disp=P]1.4.0 S&P/TSX Composite Index (Daily)[/url]. The Canadian market is overbought.
Posted by Cobra at 10:54 PM 2 comments 
Thursday, November 27, 200811/26/2008 Market Recap: One more strength test
According to the statistics in the past 56 years, the probability of rally two days before or after Thanksgiving is about 80%. Tomorrow the market will open a half day, hopefully there is no surprise. In the short term, the market is very close to overbought, and in the intermediate term there are three buy signals already, while we still need to see if the pullback can form a higher low.
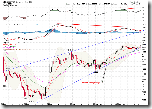
[url=http://stockcharts.com/def/servlet/Favorites.CServlet?obj=ID2393449&cmd=show[s139439402]&disp=P]0.0.2 SPY Short-term Trading Signals[/url]. This chart has given several overbought signals, but the most accurate one NYADV is not there yet. Based on my simple strength judgement which compares up days and down days, if the high tomorrow can be above 92.06, we will confirm that the up strength is stronger.
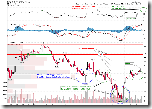
[url=http://stockcharts.com/def/servlet/Favorites.CServlet?obj=ID2393449&cmd=show[s130140412]&disp=P]1.4.0 S&P/TSX Composite Index (Daily)[/url]. Very close to oversold. On the Tuesday report, the statistics shows that VIX breaking out of ENV 10 is actually bullish, however it will be over bullish if ENV 20 is broken. Take a look at the ENV 20 (red curve at the bottom), VIX is not very far from breaking it.
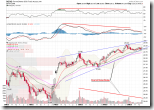
[url=http://stockcharts.com/def/servlet/Favorites.CServlet?obj=ID2393449&cmd=show[s126616985]&disp=P]1.0.3 S&P 500 SPDRs (SPY 60 min)[/url], [url=http://stockcharts.com/def/servlet/Favorites.CServlet?obj=ID2393449&cmd=show[s126618051]&disp=P]1.1.5 PowerShares QQQ Trust (QQQQ 60 min)[/url]. The pattern on the 60-min chart is likely a head and shoulders bottom, and a bigger head and shoulders bottom might be forming. The theoretical target of QQQQ is 32.23. By the way, RSI on the stop of chart is almost overbought. If you look more carefully at the 60-min chart, overbought/oversold of RSI is quite accurate on the 60-min chart.
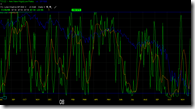
On T21122 of Telechart, as discussed previously, 4 week new high / low index is very useful. It is not in the overbought region at 90 yet.
As a summary, a few short-term overbought signals, NYADV, VIX ENV 20, RSI on 60-min chart, and T2122, are not in place yet. The reason of listing them here is for your attention, it is not a bad idea to lock a part of profit. The second reason is that, although I believe the pullback can happen at any time (in fact recently the market pulled back significantly in the middle of the day), I will not short at the current level because the short-term sell signals are not ready yet. My strategy is to buy dip first if there are many mid-term buy signals, and will only go short when many short-term signals are pointing to pullback.
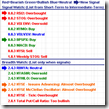
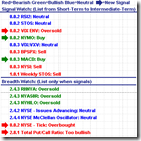
[url=http://stockcharts.com/def/servlet/Favorites.CServlet?obj=ID2393449&cmd=show[s124013638]&disp=P]0.0.0 Signal Watch and Daily Highlights[/url]. Here is the overview of all signals. If the market rallies for two more days, most likely all short-term signals will be oversold, and mid-term signals will be buy.
[url=http://stockcharts.com/def/servlet/Favorites.CServlet?obj=ID2393449&cmd=show[s132765947]&disp=P]3.0.3 20 Year Treasury Bond Fund iShares (TLT Daily)[/url]. I have been worrying about bond recently. The stock market is going up while the bond rallied too. However candles in recent two days on TLT have high likelihood of reversal, maybe I need not to worry about it? If tomorrow the market goes up and the bond goes up again, considered so many close-to-overbought signals aforementioned, I will feel quite bearish.
[url=http://stockcharts.com/def/servlet/Favorites.CServlet?obj=ID2393449&cmd=show[s134697338]&disp=P]1.1.6 PowerShares QQQ Trust (QQQQ 15 min)[/url]. MACD and RSI negative divergence.
[url=http://stockcharts.com/def/servlet/Favorites.CServlet?obj=ID2393449&cmd=show[s142228780]&disp=P]1.4.3 S&P/TSX Composite Index (15 min)[/url], On the Canadian market, Bearish Rising Wedge, MACD and RSI show negative divergence, not a good news.
[url=http://stockcharts.com/def/servlet/Favorites.CServlet?obj=ID2393449&cmd=show[s111487104]&disp=P]1.5.0 Shanghai Stock Exchange Composite Index (Daily)[/url]. Although China cut the rate but it didn't break out, What a pity.
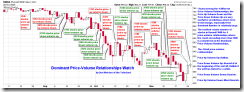
[url=http://stockcharts.com/def/servlet/Favorites.CServlet?obj=ID2393449&cmd=show[s142685381]&disp=P]1.3.7 Russell 3000 Dominant Price-Volume Relationships[/url], Dominant Price-Volume Relationships on Wednesday was 1719 stocks price up volume down. This might be affected by the holiday, so a series of bearish reading may not mean anything.
[url=http://stockcharts.com/def/servlet/Favorites.CServlet?obj=ID2393449&cmd=show[s133859547]&disp=P]1.0.6 S&P 500 Bullish Percent Index[/url], the buy signal on SPX bullish percent index has been confirmed by all major indices.
Posted by Cobra at 8:17 PM 1 comments
Tuesday, November 25, 200811/25/2008 Market Recap: No title
Tomorrow the market may still pull back since the short-term signals which supported the pullback listed in yesterday report are still there. Today we have two mid-term buy signals, but it is too early to draw a conclusion that the intermediate-term trend is up before knowing how big the pullback is.
[url=http://stockcharts.com/def/servlet/Favorites.CServlet?obj=ID2393449&cmd=show[s139439402]&disp=P]0.0.2 SPY Short-term Trading Signal[/url]. All problems are explained on this chart. Black candle with high probability of reversal, oversold VIX ENV, TICK closed above 1000, and three up days with decreasing volume which is a negative price-volume relationships, all are yelling short-term pullback. On the other hand, what is different from the conventional wisdom is that, the statistics show that oversold VIX ENV and overbought TICK often show up when the market is relatively strong, the market may pullback in the short term however a decent rally can be expected over a longer period. (statistics is at http://quantifiableedges.blogspot.com/2008/05/is-low-vix-short-trigger.html).
[url=http://stockcharts.com/def/servlet/Favorites.CServlet?obj=ID2393449&cmd=show[s142685381]&disp=P]1.3.7 Russell 3000 Dominant Price-Volume Relationships[/url], 1207 stocks price up volume down, bearish price-volume relationship for two days, this also means the market is due for a pullback.
[url=http://stockcharts.com/def/servlet/Favorites.CServlet?obj=ID2393449&cmd=show[s124013638]&disp=P]0.0.0 Signal Watch and Daily Highlights[/url]. Here is the overview of all signals. CPC is very low at 0.79 today, which isn't a good sign.
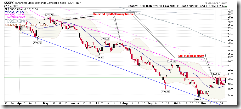
[url=http://stockcharts.com/def/servlet/Favorites.CServlet?obj=ID2393449&cmd=show[s122111676]&disp=P]3.0.0 10Y T-Bill Yield[/url]. This is why I have a little hope about an intermediate-term up, ROC 30 is going further down. At such a level, bond has little yield and the market may likely bounce back up. You may check out the accuracy of TNX ROC30 in the past: [url=http://stockcharts.com/def/servlet/Favorites.CServlet?obj=ID2393449&cmd=show[e137695390]&disp=P]8.0.4 Market top/bottom by ROC30 of 10Y T-Bill Yield 2005-2008[/url], [url=http://stockcharts.com/def/servlet/Favorites.CServlet?obj=ID2393449&cmd=show[s137696214]&disp=P]8.0.5 Market top/bottom by ROC30 of 10Y T-Bill Yield 2001-2004[/url].
[url=http://stockcharts.com/def/servlet/Favorites.CServlet?obj=ID2393449&cmd=show[s132765947]&disp=P]3.0.3 20 Year Treasury Bond Fund iShares (TLT Daily)[/url]. TLT is possibly a hanging man, and there are several gaps below the current level. Furthermore, [url=http://stockcharts.com/def/servlet/Favorites.CServlet?obj=ID2393449&cmd=show[s122111676]&disp=P]3.0.0[/url] has shown that the bond yield is very low, so I doubt how big the upside room is for TLT. And it is reasonable to believe TLT has formed a hanging man pattern and due for a pullback, which may cause a rally of the stock market.

Posted by Cobra at 8:51 PM 0 comments
Newer Posts Older Posts Home |
|
|
 [复制链接]


